Wireshark comes with powerful and flexible columns features. We can add any number of columns, sort them and so on. I’m pretty sure any analyst has his own set of profiles with different columns.
The easiest way to add a column is the next: select a packet of interest, find the field you wanna build column of, right click -> “Apply as column”
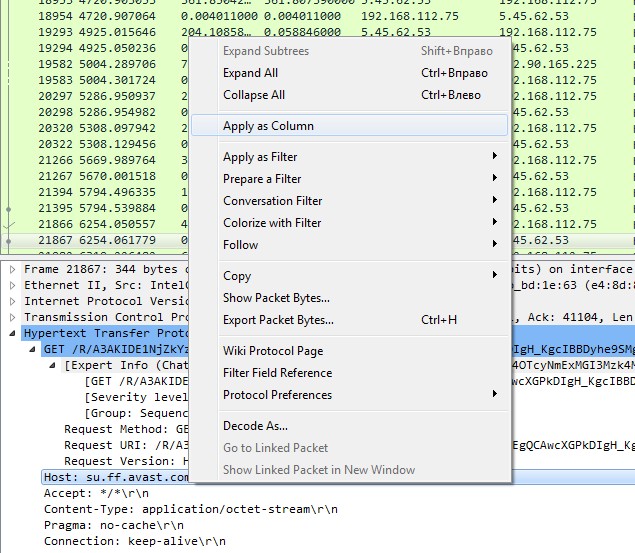
And we’ll get needed column:
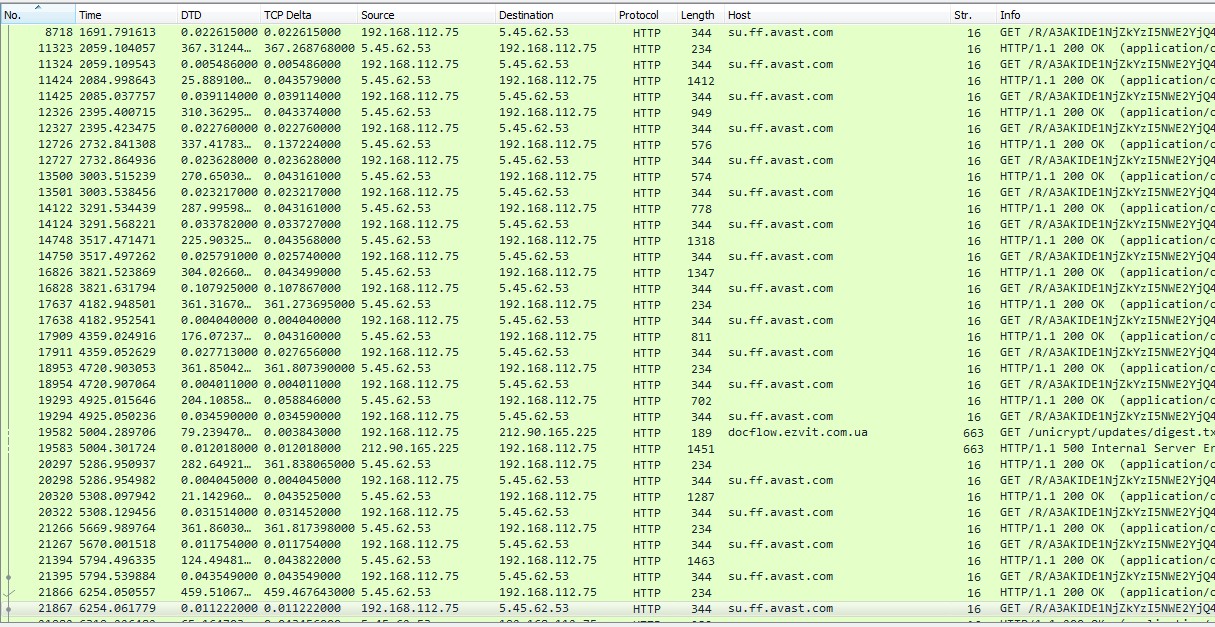
Nice and handy feature!
Now let’s proceed to the hint.
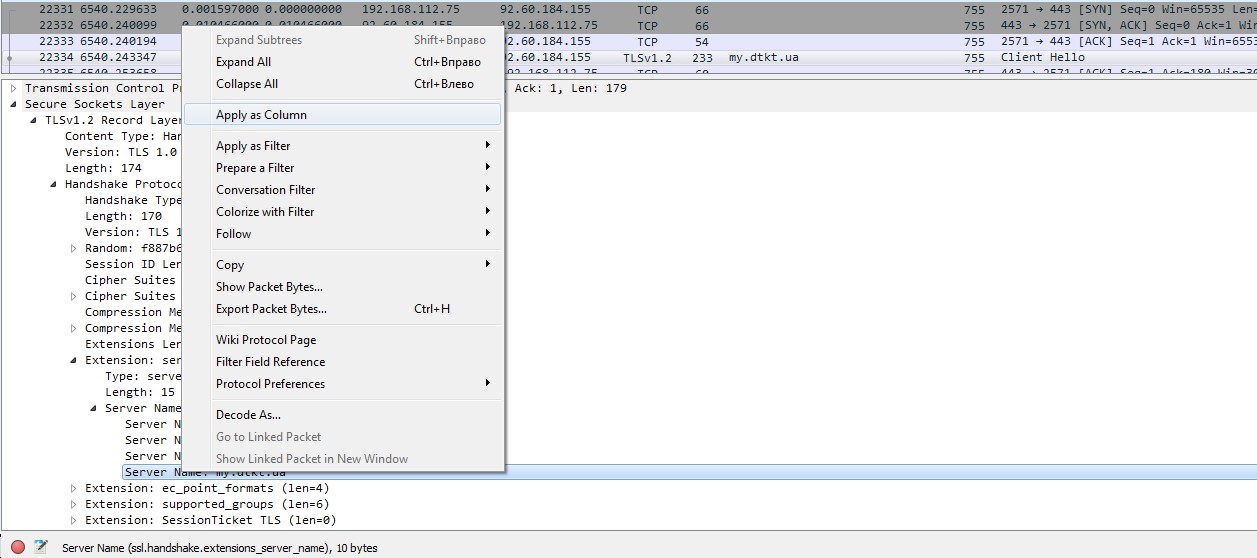
A couple of days ago I was performing some analysis which involved host names. Although 50% of traffic was using HTTP, the second half went through HTTPS. Actually, if we have TLS “Client hello” packet captured, it may contain server (host) name as well. We can spot it if we open extension field named “Server Name”. Of course, it’s possible to apply it as column too.
This is much better, but.. there is always not enough free space for Wireshark on the monitor. Two columns with similar fields take a lot of space. Wouldn’t it be nice to combine these two columns into one?
Check it out – it’s possible! Column editor indeed understands logical operators.
Go to the “Edit – Preferences – Columns” menu, select column that was created for HTTP hosts and just add the second field for HTTPS hostnames using OR operator like the next:
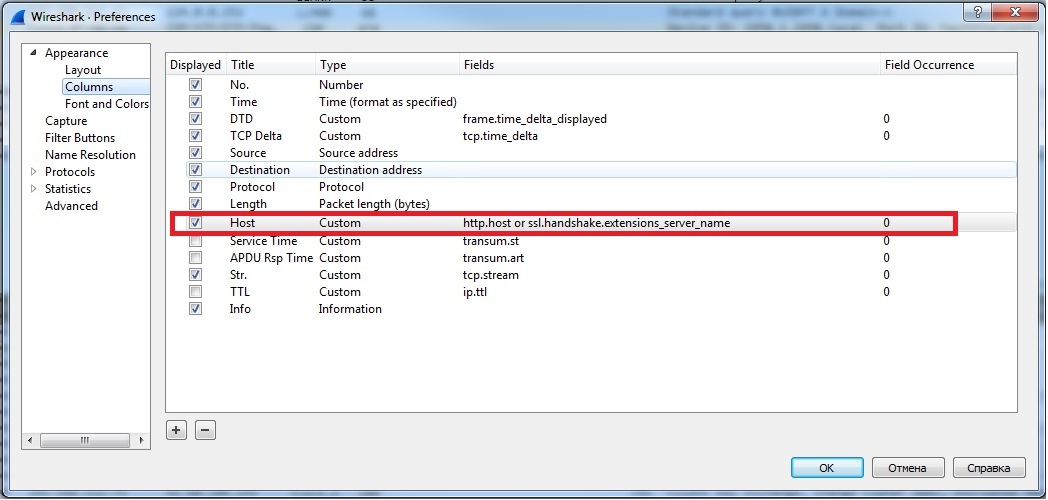
And you’ll get one column for both fields. In addition to these I added one more field “dns.resp.name” for spotting hostnames for which I’ve got DNS responses. That made it easier to spot chains like “DNS response -> GET request”.
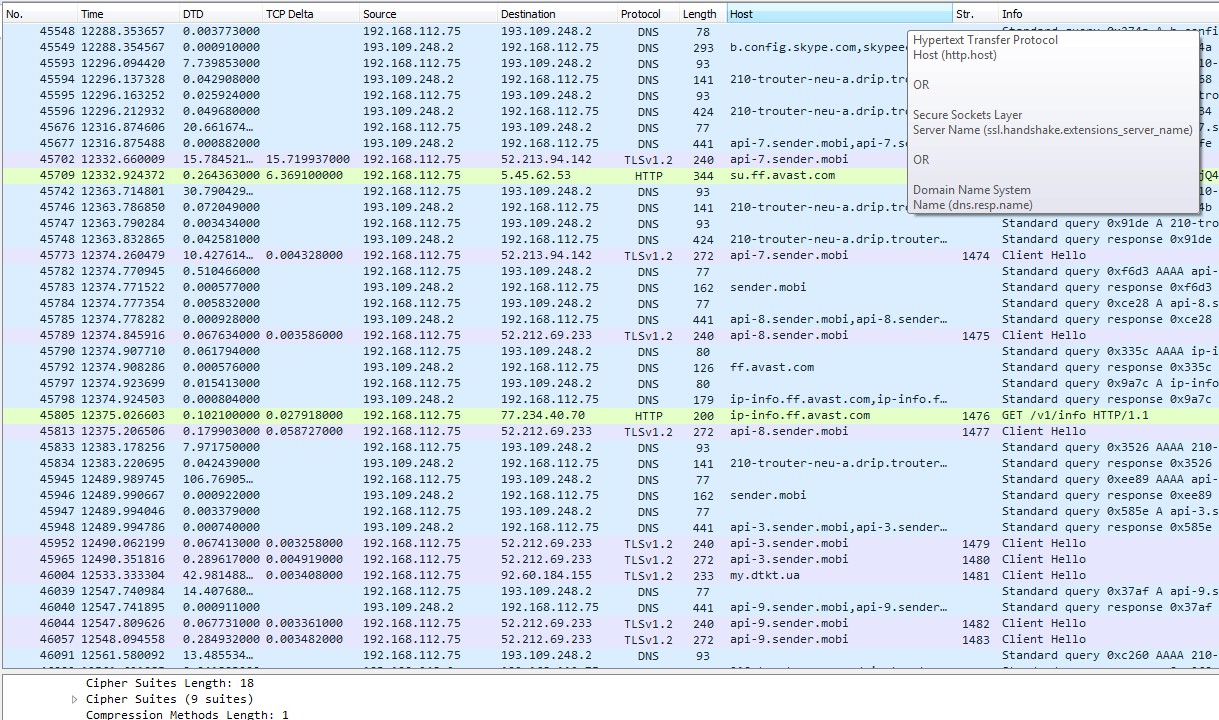
You can move mouse cursor over column title and see what fields is it built for, you can sort it usual way and it is very compact! Now you have more free space to add another columns.
Happy Wiresharking and thanks to developers for that cool feature!
4
Love this!
Thanks Betty!
See you in Portugal!
Nice. Thanks a lot. Have had dual (or more) column, mostly empty, to see what I want on my Wireshark many times and always desired something like this! It’s so simple when you see it! Many many thanks.
Glad you found it helpful!
That’s a great tip Vladimir. Goes to show that even experts are always able to learn more.
Hi Philip! Thanks, glad you liked it!
Great tip Vladimir.
Thanks Paul!
Very cool.
Great tip!
Hey Vlad,
thanks for your hint. I am using it for displaying the Hop Limit from IPv6 and the TTL from IPv4 in one column: “ipv6.hlim || ip.ttl”.
Similarly the UDP and TCP Stream index: “tcp.stream || udp.stream”.
Ciao,
Johannes